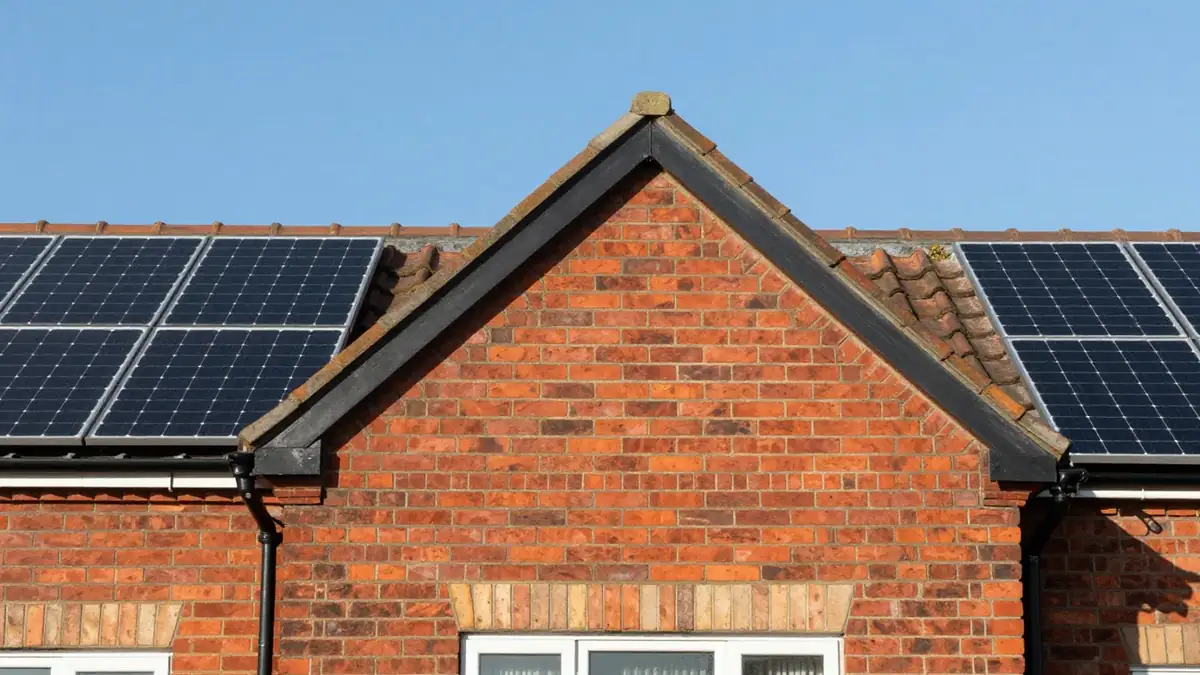
A south-facing roof is the textbook choice for solar panels in the UK. Plenty of homes do not have one. Many have roofs that face east and west instead.
So how much do you lose? Because the tool is free, we ran the European Commission’s PVGIS ourselves to find out. This post shows the inputs and the results, so you can check them.
How we ran the numbers
We used PVGIS v5.2, the free tool from the European Commission’s Joint Research Centre. Every run used 1 kWp of panels and 14% system losses. We set the same figure for every location and roof face.
We chose two locations. The first is central Birmingham, at latitude 52.48 and longitude -1.89. The second is central Leeds, at latitude 53.80 and longitude -1.55. We tested pitches of 35 and 20 degrees, with the panels facing south, east and west.
PVGIS reports output in kWh per year for each 1 kWp. It gives a clean like-for-like comparison, because the panel count does not change.
The yearly results
Here is what PVGIS returned for 1 kWp, in kWh a year.
| Location and pitch | South | East | West | East-west average |
|---|---|---|---|---|
| Birmingham, 35 degrees | 969 | 777 | 756 | 766 |
| Birmingham, 20 degrees | 928 | 799 | 785 | 792 |
| Leeds, 35 degrees | 947 | 748 | 738 | 743 |
| Leeds, 20 degrees | 904 | 770 | 763 | 766 |
At 35 degrees, a split east-west array makes about 79% of the south figure in Birmingham and about 78% in Leeds. At 20 degrees, the gap narrows to about 85% in both cities. So you lose roughly 15% to 22% a year, depending on pitch.
The average assumes half your panels face east and half face west. If you split panels unevenly, expect the result to lean toward the larger side, because that side contributes more.
Why the gap is smaller on low pitches
A shallow roof gets less benefit from facing south, because a panel tilted at 20 degrees points more towards the sky than towards any one direction. That is why the 20 degree roof loses less when it turns away from south in our runs.
The 35 degree south roof does best of all, though. Its yearly figure is the highest in the table. So the best roof is still south at a good pitch, but the penalty for east-west is smaller than many people expect.
The monthly pattern: winter takes the hit
Yearly totals hide a seasonal gap. Here are the Birmingham results at 35 degrees, in kWh per kWp.
| Month | South | East | West |
|---|---|---|---|
| January | 37 | 17 | 17 |
| July | 119 | 113 | 110 |
| December | 34 | 14 | 14 |
In July, east or west panels make about 94% of the south figure, taking the average of the two. In December, they make about 41%. Winter is the weak spot, because the low sun misses panels that face away from south.
That matters if you want panels to cut winter bills. It matters less if you export in summer and use the Smart Export Guarantee. Therefore, ask your installer to show monthly output for each roof face.
A worked example
PVGIS scales with system size, so you can multiply the table by your kWp. Take a 4 kWp system in Birmingham at 35 degrees. Facing south, that is about 3,875 kWh a year (4 x 969). Split east-west, it is about 3,064 kWh (4 x 766).
The gap is roughly 800 kWh a year for the same panels. On the other hand, if east-west lets you fit a 5 kWp system instead, 5 x 766 gives about 3,830 kWh. That nearly closes the gap, although the extra panel cost applies.
Reading the result alongside your own roof
Roof space often decides the answer, since an east-west layout can hold panels on both slopes and the system may be bigger. A roof with one usable south slope may fit far fewer panels than the same house with both slopes in use. A bigger split system can beat a smaller south one.
Bigger also costs more, though. Check the numbers in our solar panel cost guide before you decide. Our guide to how many panels you need explains how to size a system to your usage.
East-west roofs may also change your battery decision. Because output spreads across the day, you may well use more of it directly. Read whether a solar battery is worth it to see how to test that for your own bills.
What to ask on your quote
Ask each installer for output per roof face, in kWh a year, because a quote that gives one blended figure hides the east-west penalty. If an installer promises south-facing results from an east-west roof, treat that as a warning sign. See solar quote red flags for others.
Also, check how long the panels will keep performing. Our upcoming post on solar panel degradation and performance warranties covers what warranties promise.
Next, you should work out what the generation is worth. The solar panel payback guide shows how to turn kWh into pounds. Then run your quote through the free solar quote checker to see the price per kWp.
In addition, regional sunshine matters. Compare our notes on solar quotes in the West Midlands with what installers quote across Yorkshire and the Humber, and use your own address in PVGIS for a closer answer.
Limits of our runs
PVGIS models an unshaded roof with a fixed tilt, so your real output will differ if trees, chimneys or neighbouring buildings shade the roof. We did not model batteries, usage or tariffs. The figures are estimates, not guarantees. Prices and output vary, so get written quotes before you commit.